The Seasonal Pattern Scanner that finds what works automatically
Stop eyeballing charts. The scanner automatically detects statistically significant seasonal patterns in any symbol - the exact date ranges where it has historically risen, ranked by win rate, average return and strength.
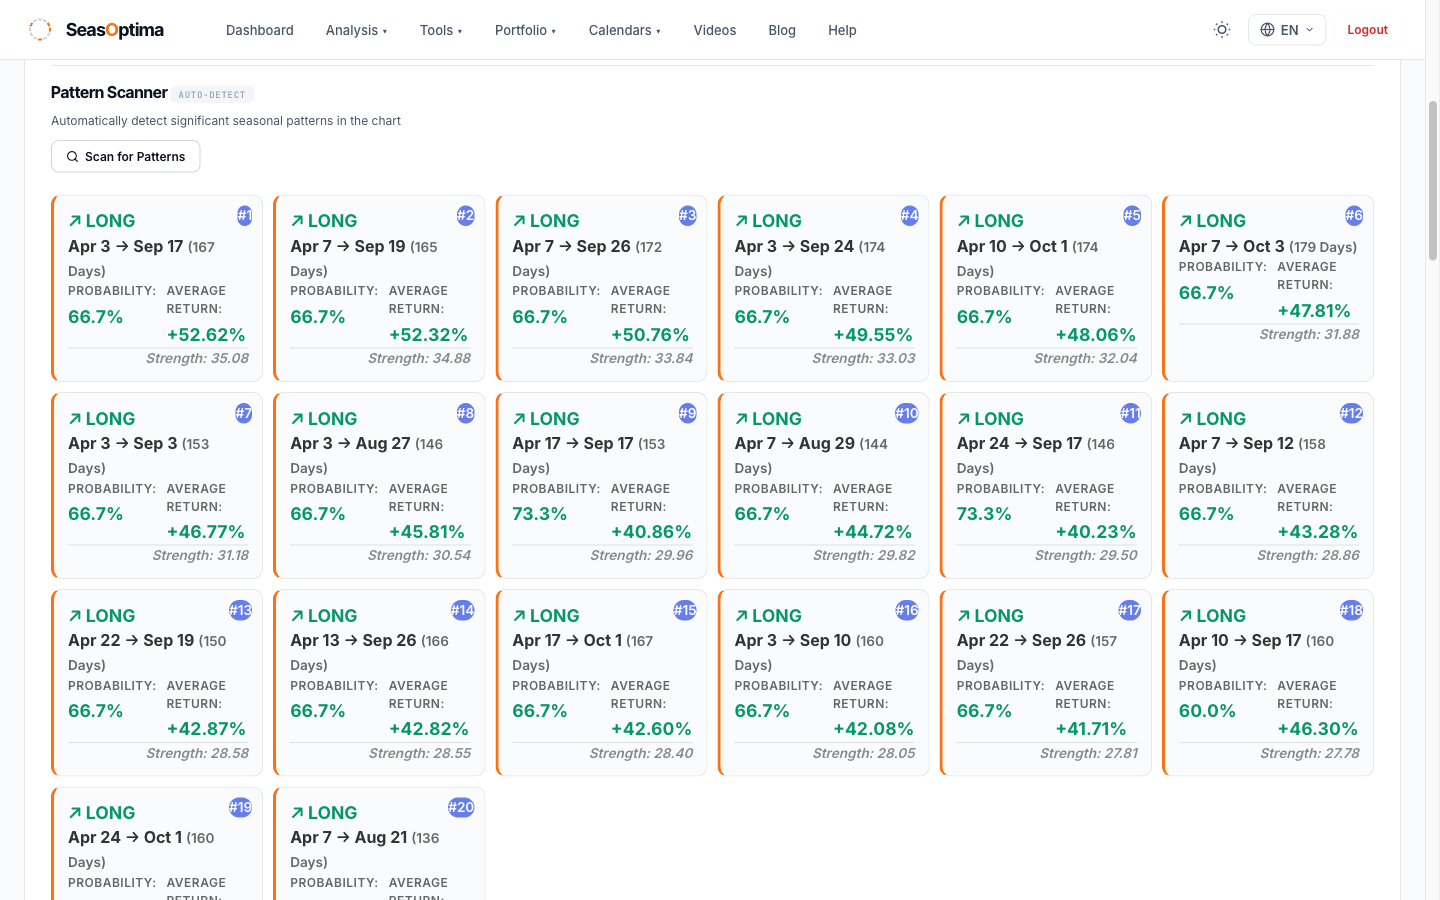
Patterns you would never spot by eye
The scanner reads three decades of history and surfaces only the windows that repeat.
Automatic detection
One click scans the full history of any symbol and surfaces every recurring seasonal window - no manual chart-reading.
Ranked by strength
Each detected pattern comes with win rate, average return, probability and a strength score, so you focus on the most reliable ones.
Any symbol, any timeframe
Run the scanner on 47,000+ stocks, ETFs, indices and FX over 5, 10, 15 or 30 years, and filter by bull/bear regime or presidential cycle.
How it works
Three clicks from a symbol to its hidden seasonal patterns.
Open any symbol
Go to any of the 47,000+ symbol pages and choose your timeframes.
Scan for patterns
Hit Scan for Patterns - the engine analyses the full history instantly.
Act on the strongest
Review the ranked pattern cards with win rate, return and strength, then drill into the chart.
Who uses the scanner
Swing traders
Find the precise date windows a stock tends to run, instead of guessing.
Investors
Spot the months and seasons a holding has historically favoured.
Analysts
Auto-detect patterns across a whole watchlist or sector in minutes.
Questions
What is a seasonal pattern scanner?
A tool that automatically analyses a symbol's full price history and detects the recurring calendar windows where it has tended to rise or fall, reporting each with its win rate, average return and statistical strength.
Which symbols can I scan?
Any of the 47,000+ stocks, ETFs, indices and currency pairs on SeasOptima, with up to 30 years of split- and dividend-adjusted data.
Is a detected pattern a guarantee?
No. Detected patterns are statistical, based on historical data, for educational and informational purposes only. They are not investment advice and past performance does not guarantee future results.
Is the scanner free?
No. The seasonal pattern scanner is a SeasOptima Premium feature. Browsing symbol pages is free, but auto-detecting and ranking patterns requires Premium.
Auto-detect your first seasonal pattern today
Stop reading charts by hand. Let the scanner find the patterns for you with SeasOptima Premium.
Get the Scanner with Premium