Find the best months to buy any stock
See a colour-coded map of every calendar month - average return and win rate over up to 30 years - so you know which months a stock has historically been strong or weak.
Know the strong months before you buy
A month-by-month heat map turns 30 years of price history into a single glance.
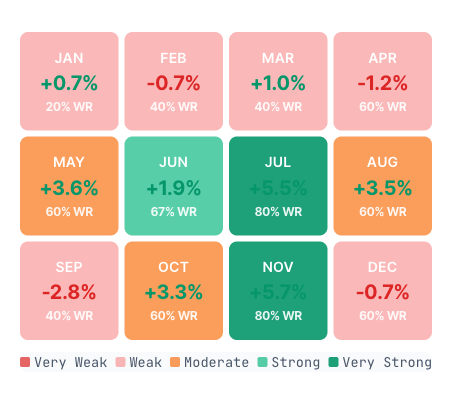
Every month scored
See the average return and historical win rate for all 12 calendar months, colour-coded from very weak to very strong.
Strong vs weak at a glance
Green months have historically risen, red months have historically fallen - no charts to read, just the pattern.
Any symbol, 30 years
Check the best months for 47,000+ stocks, ETFs, indices and currency pairs, with up to 30 years of adjusted data.
How it works
From a ticker to its strongest months in three steps.
Search a symbol
Type any stock, ETF or index - from Apple to the S&P 500.
Read the heat map
See each month coloured by its historical strength, with return and win rate.
Plan your timing
Focus on the green months and avoid the red ones when planning entries.
Who it is for
Active traders
Time entries around the months a stock has historically been strongest.
Investors
Add to positions in the calendar months a holding has historically favoured.
Long-term planners
Understand the seasonal rhythm of a stock before committing capital.
Questions
What are the best months to buy stocks?
It depends on the stock. SeasOptima shows, for any symbol, which calendar months have historically had the highest average return and win rate over up to 30 years - so the answer is specific to each company, ETF or index, not a single rule of thumb.
How is each month scored?
Each month shows its average historical return and the share of years it was positive (win rate), colour-coded from very weak to very strong across up to 30 years of split- and dividend-adjusted data.
Do the best months repeat every year?
No. Monthly seasonality is a statistical tendency based on historical data, for educational and informational purposes only. It is not investment advice and past performance does not guarantee future results.
Is it free?
You can view the monthly heat map on individual symbol pages for free. Screening the whole market for the best months and the advanced tools are part of SeasOptima Premium.
Find the best months for any stock today
Turn 30 years of history into a single heat map. Start with SeasOptima Premium.
Get SeasOptima Premium